O₂ Dissociation on Pt(111) and at the Pt(211) Step (Energy Barrier)
1. Introduction
This tutorial calculates the dissociation barrier of an adsorbed O₂ molecule on the flat Pt(111) surface and at the Pt(211) step, reproducing results from the following manuscript:
Manuscript
Ž. Šljivančanin and B. Hammer, "Oxygen dissociation at close-packed Pt terraces, Pt steps, and Ag-covered Pt steps studied with density functional theory", Surface Science 515, 235 (2002). DOI:10.1016/S0039-6028(02)01908-8. 1
This tutorial builds upon the Terrace Steps on Platinum (111) Surface tutorial, where the slabs with the O₂ precursor and the dissociated O pair are created. Here, both are relaxed, with the manuscript's functional on the platform or with the MACE machine-learned force field in the notebook, and a climbing-image nudged elastic band (NEB) calculation with the manuscript's functional runs between the two minima. The manuscript's own method also runs, with MACE in the notebook: the O–O distance is held at each point of a 0.2 Å grid while every other coordinate relaxes. The barriers are compared with Table 1 of the manuscript.
The figure below shows FIG. 1 of the manuscript; the paths computed here are panels A (Pt(111), top–fcc–bridge) and B (Pt(211) step, top–bridge–top):

2. Prerequisites
Before starting this tutorial, one of the following steps should be completed:
- Follow the Terrace Steps on Platinum (111) Surface tutorial, using the
defect_surface_step_platinum.ipynbnotebook embedded in its section 5, to create and savePt(111) O2 precursor,Pt(111) 2O dissociated,Pt(211) step O2 precursorandPt(211) step 2O dissociated, OR - Have the four materials saved in the
uploadsfolder or in the account's materials collection
3. Workflow overview
The barrier calculation consists of the following steps:
- Set up the environment and parameters: Configure material names, the MACE force field, the scan, the Density Functional Theory (DFT) model, and compute resources
- Authenticate and initialize API client: Connect to the platform
- Load materials: Import the four materials by name and print their atom counts
- Configure the model: One DFT model for the RPBE relaxations and the NEB
- Configure compute resources: Select the cluster, queue, nodes, and processor settings
- Relax and scan with MACE: Relax the materials if
RELAXATION = "MACE", then scan the O–O distance - Relax with RPBE and run the nudged elastic band: If
RELAXATION = "DFT", the four materials are relaxed with RPBE on the platform; then one climbing-image NEB per surface runs between the relaxed materials - Retrieve results: The NEB energy profile, barrier, O–O distance at the highest image, and image error
- Compare with the manuscript: Print the MACE values, and the NEB values if run, beside the manuscript's
4. Calculation parameters
| MACE scan | RPBE NEB | Šljivančanin & Hammer | |
|---|---|---|---|
| Where it runs | in the notebook | on the platform, Quantum ESPRESSO 7.5: RPBE through input_dft needs 7.x |
code not stated |
| Energy | MACE-MP-0 large, no dispersion correction | RPBE of Hammer, Hansen and Nørskov | RPBE |
| Pseudopotentials, cutoff | — | ultrasoft (GBRV), 40 / 200 Ry | ultrasoft (Vanderbilt), 25 Ry |
| k-points, smearing | — | 2×2×1, Marzari-Vanderbilt 0.01 Ry | 6×4×1, not stated |
| Spin | — | not spin-polarized | not spin-polarized for the adsorbed states |
| Transition state | highest point, O–O fixed on a 0.2 Å grid | climbing image, path threshold 0.1 eV/Å | highest point, O–O fixed on a 0.2 Å grid |
| Relaxation | all atoms, in the scan all but the O–O distance; largest force below 0.1 eV/Å | all atoms, the end points relaxed with RPBE, force components below 0.1 eV/Å (RELAXATION = "DFT"), or with MACE ("MACE") |
upper half of the Pt atoms and the O atoms, total force below 0.1 eV/Å |
| Pt lattice constant | 3.943 Å (Standata, mp-126) | 3.943 Å | 4.02 Å |
| Pt(111) slab | 3 layers × 16 Pt | 3 layers × 16 Pt | 4 layers × 9 Pt |
| Pt(211) slab | 8 (211) planes × 4 Pt along the step | 8 (211) planes × 4 Pt | 12 (211) planes × 3 Pt along the step |
The dissociated pair, not given in the manuscript, ends the scan and the NEB: both O in neighbouring fcc hollows on Pt(111),
on step-edge bridges 2 Pt apart on Pt(211). A material already relaxed with the same k-grid, or still relaxing, is
reused, and so is an NEB job from the same precursor that is queued, running or finished with the same k-grid, also
when the application version or a setting of cell 1.4, N_IMAGES included, has changed.
5. Step-by-step instructions
5.1. Open the notebook
Navigate to the API examples repository and open the barrier notebook:
1 | |
5.2. Configure parameters
The parameters cells set the material names, the k-grid of each surface, the MACE force field and the scan, the compute resources, and the DFT model:
1 2 3 4 5 6 7 8 9 10 11 12 13 14 15 16 17 18 19 20 21 22 23 24 25 26 27 28 29 30 31 32 33 34 35 36 37 38 39 40 41 42 43 44 45 46 47 48 49 50 51 52 53 | |
5.3. Run the notebook
Execute all cells by selecting Run > Run All from the menu.
The notebook first authenticates with the platform, then runs the steps listed in section 3.
5.4. Monitor progress
The MACE relaxations and scans run in the notebook; it then polls the relaxation and NEB jobs on the platform.
5.5. Analyze results
The last cells print the barrier and the O–O distance at the transition state of each surface beside the manuscript's values, and plot the scans. The Pt(111) NEB lines follow its MACE lines:
1 2 3 4 5 6 7 | |
6. Expected results
Table 1 of the manuscript gives the barrier from the O₂ precursor, computed with RPBE, as 0.6 eV on Pt(111) (top–fcc–bridge, FIG. 1 A) and 0.9 eV at the Pt(211) step (top–bridge–top, FIG. 1 B), with an O–O distance at the transition state of 2.4 Å and 3.0 Å. FIG. 2 draws the same barriers as energy levels measured from gas-phase O₂; the scans and profiles here are measured from the precursor.
6.1. Comparison with published results
| Šljivančanin & Hammer, RPBE | MACE scan | RPBE NEB | |
|---|---|---|---|
| Pt(111) barrier | 0.6 eV | 0.205 eV | 0.205 eV |
| Pt(211) barrier | 0.9 eV | 0.740 eV | not computed |
| Pt(111) O–O at the transition state | 2.4 Å | 1.80 Å | 1.78 Å |
| Pt(211) O–O at the transition state | 3.0 Å | 1.80 Å | not computed |
The figure below shows the Pt(111) and Pt(211) panels of FIG. 2 of the manuscript (left) beside the MACE scans of this tutorial (right), where the dashed lines mark the manuscript's barriers:
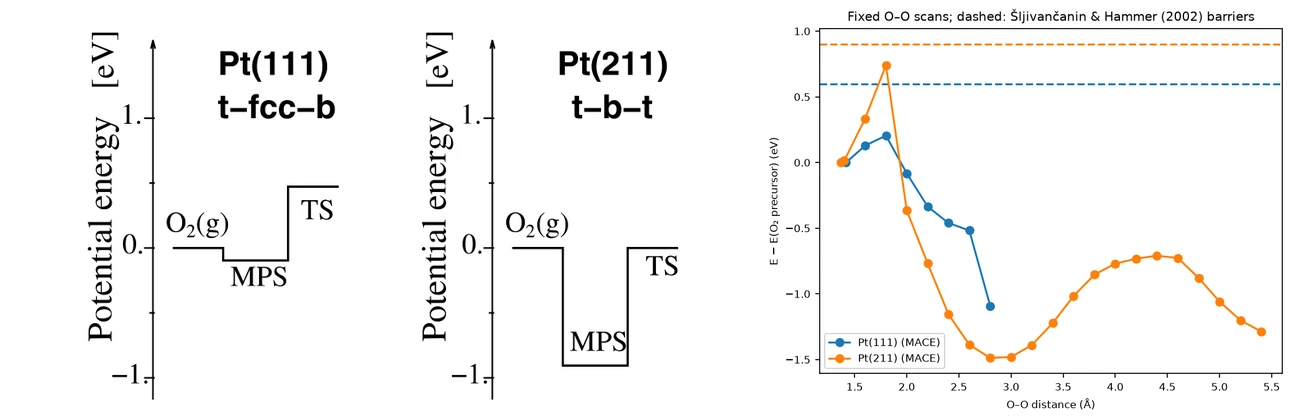
The Pt(211) RPBE NEB runs the same way, from its entry in SURFACES.
6.2. Difference from the manuscript
On Pt(111), the RPBE NEB and the MACE scan agree with each other: a barrier of 0.205 eV, with the transition state at an O–O distance of 1.78 Å and 1.80 Å. Both are below the manuscript's 0.6 eV at 2.4 Å. These settings differ:
| Setting | Šljivančanin & Hammer | This tutorial | Parameter to change |
|---|---|---|---|
| Pt(111) slab | 4 layers × 9 Pt (p. 236, FIG. 1 A) | 3 layers × 16 Pt | —, made's Pt(111) cell holds 4 Pt per layer (9 is not reachable); 4 layers moves the O off the fcc hollow (structure notebook, section 4) |
| Pt(111) vacuum | ≈10 Å (p. 236) | 15 Å | vacuum in SLAB_PARAMETERS, structure notebook |
| k-points | 6×4×1 for its 9-Pt cell (p. 237) | 2×2×1 | "kgrid" in SURFACES, cell 1.2 |
| Pt lattice constant | 4.02 Å, RPBE (p. 236) | 3.943 Å, Standata, not strained | — |
| Dissociated pair | not given | both O in neighbouring fcc hollows | — |
| Transition state | constrained relaxations, O–O fixed on a 0.2 Å grid (p. 237) | climbing-image NEB, one intermediate image | —, the platform cannot hold a fixed O–O distance; the MACE scan follows the manuscript's method |
| Relaxation | upper half of the Pt atoms and the O atoms, the rest fixed (p. 236) | all atoms | —, the platform keeps no fixed atoms |
| Force criterion | two-norm of the total force < 0.1 eV/Å (p. 236) | each force component < 0.1 eV/Å; MACE: largest force on an atom < 0.1 eV/Å | forc_conv_thr in RELAXATION_SETTINGS, cell 1.4; FMAX, cell 1.3 |
| Pseudopotentials, cutoff | Vanderbilt ultrasoft, 25 Ry (p. 236) | GBRV ultrasoft, 40 / 200 Ry | ECUTWFC, ECUTRHO, cell 1.4 |
Which of these settings moves the barrier is not tested here.
7. Customization options
7.1. Choose the force field, the scan and the relaxation
MACE_MODEL_FAMILY and MACE_MODEL (cell 1.3) select the MACE force field; MACE_DISPERSION = False matches
the manuscript's RPBE, which has no dispersion correction. FMAX is the largest force on an atom at which each
relaxation stops: the manuscript's 0.1 eV/Å, which it applies to the total force. OXYGEN_DISTANCE_STEP is its
0.2 Å grid, from the first point above the precursor's O–O distance to below the dissociated pair's.
RELAXATION sets the end points of the NEB. "DFT", the default and the manuscript's protocol, relaxes the four
materials as built with RPBE on the platform, four relaxation jobs before the two NEBs; a later run finds them relaxed.
"MACE" relaxes them in the notebook and submits only the NEBs, which then start from MACE minima, not RPBE minima,
so the barrier is approximate. The scan always starts from the MACE-relaxed precursor.
7.2. Adjust computational resources
The compute settings apply to the relaxations and the NEBs: by default, each job runs on one node of the OF queue
with 30 cores for up to 12 hours (TIME_LIMIT_HOURS). The default, CLUSTER_NAME = None, uses the account's first
listed cluster; setting it to a cluster's full host name uses that cluster without listing. The OF queue runs one
job on up to 10 nodes, the OR queue on one 16-core node; NODES and PPN set the job's size.
7.3. Use the manuscript's settings
The MACE scan is the manuscript's method with a force field in place of its functional. RELAXATION = "DFT"
adds the functional: the four materials relaxed and one climbing-image NEB per surface with RPBE on the platform,
six jobs on the OF queue. It is an NEB rather than a scan because the platform cannot hold a fixed O–O distance. Its cost
grows with "kgrid" in SURFACES (cell 1.2; the manuscript's 6×4×1 is on its own, smaller cells) and with
N_IMAGES; neb.x stops after NEB_MAXIMUM_ITERATIONS, converged or not, and the path is converged when the
largest NEB image error is below 0.1 eV/Å. A new "kgrid" starts new relaxation and NEB jobs; a new
N_IMAGES or NEB_MAXIMUM_ITERATIONS reuses the jobs already run from the same precursor (section 4).
- Pt(211) slab:
THICKNESS = 3in the structure notebook gives the manuscript's 12 (211) planes; made's (211) cell holds an even number of Pt along the step, so 3 is not reachable - Pt(111) slab: stays at 3 layers, where the oxygen site of the structure notebook is the fcc hollow
- Fixed atoms: all atoms relax apart from the scanned O–O distance, as the platform's NEB keeps no fixed atoms
8. Troubleshooting
8.1. Material not found
If one of the four materials is not found in the uploads folder or the account's materials collection, run
the Terrace Steps on Platinum (111) Surface tutorial first, and check that
its uploads folder holds the four materials under the names of cell 1.2.
8.2. No cluster available
If section 5.1 of the notebook prints an empty list of clusters, there is nothing to submit to, and section 5.2 stops. A cluster has to be available to the account before the notebook can run.
8.3. No NEB barrier on the first run
The platform's access token lasts one hour and can expire while the notebook waits for the relaxation and NEB jobs in section 7. The jobs keep running. Restart the kernel and run all cells again (Kernel > Restart Kernel and Run All Cells): the notebook asks for a new login and picks up the running and finished jobs.
8.4. Barrier far from the published value
Check the atom counts printed in section 3 of the notebook first:
1 2 3 4 | |
Then view the relaxed materials on the account (with RELAXATION = "MACE", named <name> relaxed MACE-MP-0
large): the O atoms of each should still sit on the sites of section 4 of the structure tutorial.
9. Interactive JupyterLite notebook
The following JupyterLite notebook demonstrates the workflow for calculating the O₂ dissociation barrier on Pt(111) and at the Pt(211) step. Select Run > Run All Cells.
10. References
-
Ž. Šljivančanin and B. Hammer. Oxygen dissociation at close-packed Pt terraces, Pt steps, and Ag-covered Pt steps studied with density functional theory. Surface Science, 515(1):235–244, 2002. URL: https://doi.org/10.1016/s0039-6028(02)01908-8. ↩